Last year, we compared winter maintenance across the Scandinavian countries by combining friction data from connected vehicles, weather insights, and national maintenance budgets. Based on this, we built a framework to evaluate how efficiently roads are kept safe during winter.
Now it’s time to do it again.
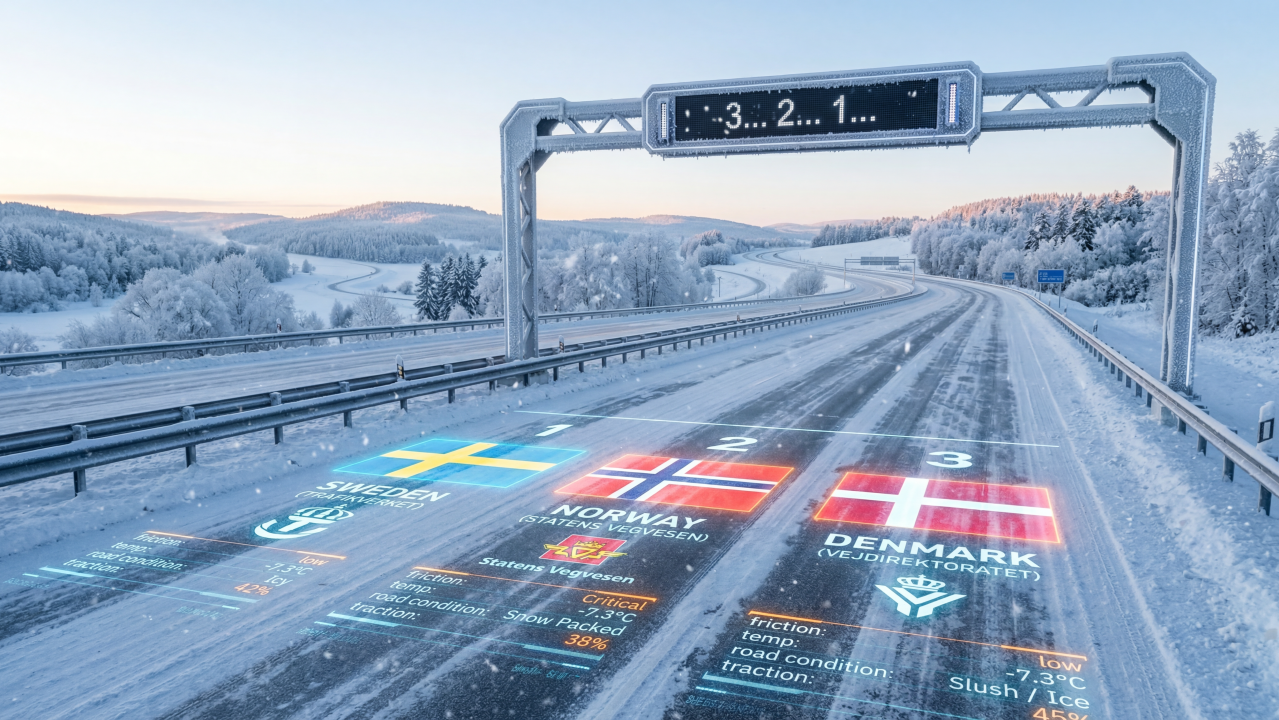
So, which country had the best winter maintenance efficiency this year?
For more information on how we collect friction data from connected vehicles:
Road Surface Information and connected vehicles
Budgets

Before looking at road conditions, it’s important to understand the baseline.
Denmark stands out with a much higher cost per kilometer, but at the same time, a lower cost per capita due to its smaller road network.
Sweden and Norway, on the other hand, manage vast and more complex networks, where geography and climate naturally make maintenance more challenging.
How do we compare road conditions?
To make the comparison fair, we defined a structured approach:
-
Exclude data during active snowfall (road condition will be poor, even with good maintenance)
-
Exclude temperatures below -6°C to reduce regional bias
-
Focus only on highways (comparable priority roads)
-
Split data into regions to account for local weather differences
-
Measure hours with more than 25% low friction
-
Use a full month of data
This allows us to compare not just conditions, but performance under comparable circumstances.
What the data shows
The charts below shows (5) on the y-axis and (4) on the x-axis.
Sweden

Norway

Denmark

Road condition summary
Average hours of low friction:
- Sweden: 85.1 hours
- Norway: 174 hours
- Denmark: 11.4 hours
It was a harsh winter across all of Scandinavia. Norway faced the greatest challenges, with more hours of low friction. Sweden and Denmark also saw a clear increase, both recording on average more than three times as many low-friction hours compared to last season. In Norway, the increase was even more pronounced, exceeding four times last year’s levels.
Weather plays a major role
To better understand the differences, we also looked at the weather conditions.
Here, we focus on two key factors: hours with air temperature below 0°C and hours with snowfall. To keep the comparison consistent, we measure both in terms of total hours.

Compared to the winter season of 2024-2025, this winter was harsher. Denmark had severely more snowfall this winter and wasn't that far from Sweden. Norway had the toughest winter of the three.
The average hours are calculated by summing all hours with snowfall and subzero temperatures across each region, and then taking the average of those regions within each country. For example:

From data to KPI: measuring efficiency
At this point, we have three key inputs: hours of winter weather, hours of low friction, and budget per kilometer.
Based on these, we can define a comparable KPI.
We start by creating a winter maintenance ratio that describes the hours of low friction in relation to the hours of winter weather:

We then define maintenance efficiency as the relationship between the winter maintenance ratio and the cost per kilometer.

The lower the efficiency index, the greater the return on investment.
The result: Denmark takes the lead

This year’s winner is Denmark, delivering the highest winter maintenance efficiency. They have the highest budget per kilometer, but they kept the friction high most of the time despite rather severe winter weather. The result is the strongest overall return on investment.
Sweden comes in a close second, maintaining stable and balanced road conditions despite a comparatively lower budget.
Norway has the highest cost, which raises the question: could differences in self-assessment and regulations be part of the reason?
What this means going forward
Winter road maintenance is complex. Weather, geography, infrastructure, and strategy all play a role.
But with connected vehicle data, we can move beyond assumptions and start measuring what actually happens on the road.
Not just who spends the most, but who delivers the safest conditions, most efficiently.